- USD/CHF flattens near 0.8340 as the US Dollar bounces back.
- Moody’s downgraded the US Sovereign Credit rating to Aa1 from Aaa.
- The SNB opened doors to negative interest rates amid global economic uncertainty.
The USD/CHF pair flattens around 0.8340 during North American trading hours on Tuesday after clawing back initial losses. The Swiss Franc pair rebounds as the US Dollar Index (DXY) bounced back after attracting bids near the weekly low around 100.00.
Earlier in the day, the US Dollar traded lower as Moody’s downgraded the United States (US) Sovereign Credit Rating due to mounting debt concerns. Additionally, fresh concerns over de-escalation in the US-China trade war had also weighed on the US Dollar. Beijing condemns Washington for discouraging the use of Huawei-made Artificial Intelligence (AI) chips and Chinese AI models, highlighting them as a threat to US export controls.
Domestically, investors await the flash S& Global Purchasing Managers’ Index (PMI) data for May, which will be released on Thursday. The PMI report is expected to show that the overall business activity grew at a steady pace.
Meanwhile, the Swiss Franc (CHF) trades higher against its major peers, but is expected to be driven by market expectations for the Swiss National Bank’s (SNB) monetary policy outlook. SNB Chairman Martin Schlegel has signaled that the central bank is ready to consider negative interest rates to battle against global economic risks.
Swiss Franc PRICE Today
The table below shows the percentage change of Swiss Franc (CHF) against listed major currencies today. Swiss Franc was the strongest against the Australian Dollar.
| USD | EUR | GBP | JPY | CAD | AUD | NZD | CHF | |
|---|---|---|---|---|---|---|---|---|
| USD | 0.03% | 0.09% | 0.07% | -0.15% | 0.91% | 0.48% | -0.09% | |
| EUR | -0.03% | 0.07% | 0.03% | -0.18% | 0.89% | 0.47% | -0.12% | |
| GBP | -0.09% | -0.07% | -0.04% | -0.25% | 0.79% | 0.42% | -0.15% | |
| JPY | -0.07% | -0.03% | 0.04% | -0.23% | 0.83% | 0.40% | -0.12% | |
| CAD | 0.15% | 0.18% | 0.25% | 0.23% | 1.07% | 0.64% | 0.10% | |
| AUD | -0.91% | -0.89% | -0.79% | -0.83% | -1.07% | -0.42% | -0.96% | |
| NZD | -0.48% | -0.47% | -0.42% | -0.40% | -0.64% | 0.42% | -0.54% | |
| CHF | 0.09% | 0.12% | 0.15% | 0.12% | -0.10% | 0.96% | 0.54% |
The heat map shows percentage changes of major currencies against each other. The base currency is picked from the left column, while the quote currency is picked from the top row. For example, if you pick the Swiss Franc from the left column and move along the horizontal line to the US Dollar, the percentage change displayed in the box will represent CHF (base)/USD (quote).
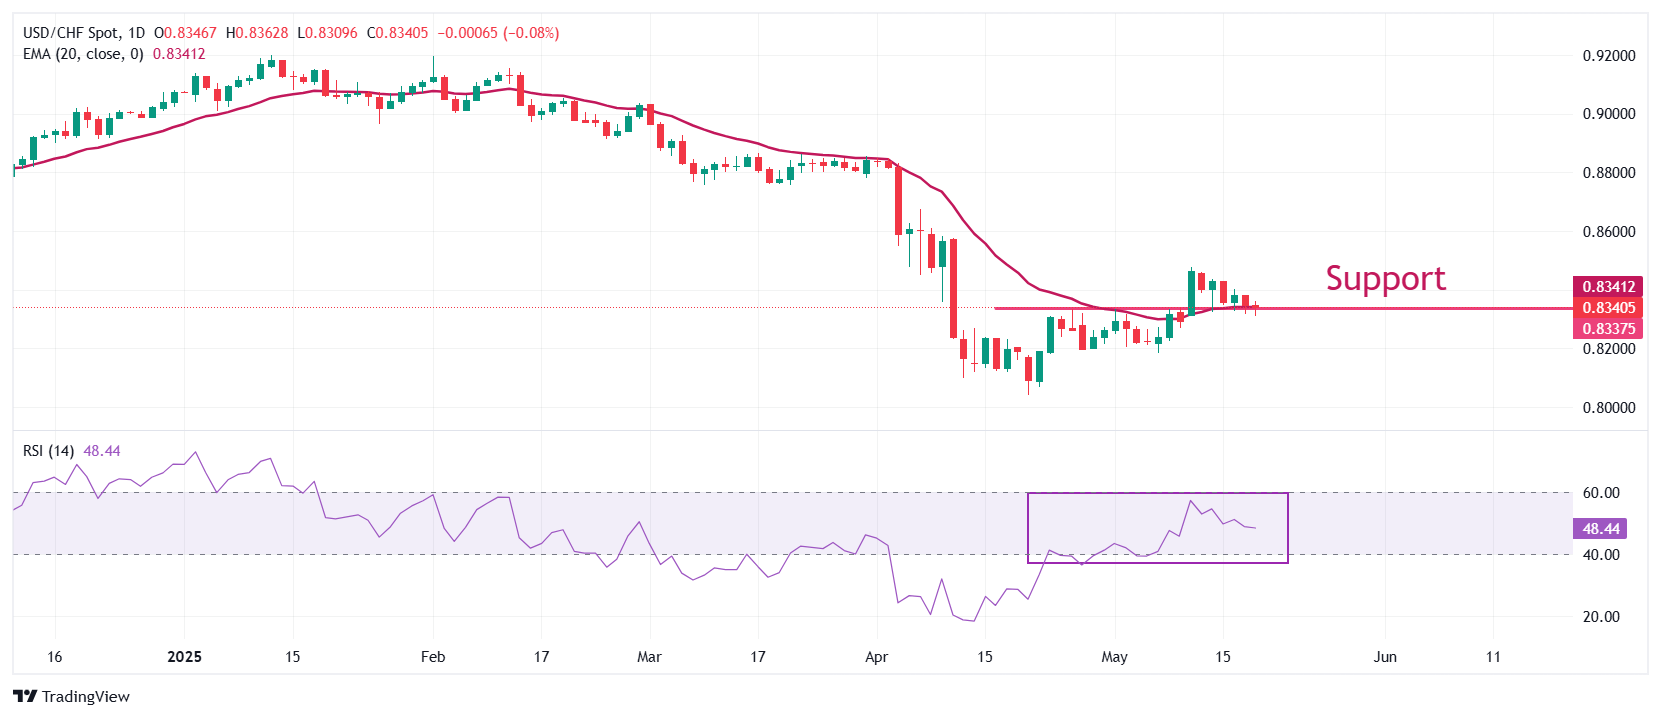
USD/CHF gauges cushion near the horizontal support plotted from the April 25 low of 0.8335, which used to be a major resistance for the pair. The asset wobbles around the 20-day Exponential Moving Average (EMA), which trades around 0.8340, indicating a sideways trend.
The 14-day Relative Strength Index (RSI) oscillates inside the 40.00-60.00, suggesting a volatility contraction.
A fresh upside move in the pair towards the April 10 high of 0.8580 and the April 8 high of 0.8611 would appear if it breaks above the psychological level of 0.8500.
On the flip side, a downside move below the May 7 low of 0.8186 would drag the asset towards the April 11 low of 0.8100, followed by the April 21 low of 0.8040.
USD/CHF daily chart
US Dollar FAQs
The US Dollar (USD) is the official currency of the United States of America, and the ‘de facto’ currency of a significant number of other countries where it is found in circulation alongside local notes. It is the most heavily traded currency in the world, accounting for over 88% of all global foreign exchange turnover, or an average of $6.6 trillion in transactions per day, according to data from 2022. Following the second world war, the USD took over from the British Pound as the world’s reserve currency. For most of its history, the US Dollar was backed by Gold, until the Bretton Woods Agreement in 1971 when the Gold Standard went away.
The most important single factor impacting on the value of the US Dollar is monetary policy, which is shaped by the Federal Reserve (Fed). The Fed has two mandates: to achieve price stability (control inflation) and foster full employment. Its primary tool to achieve these two goals is by adjusting interest rates. When prices are rising too quickly and inflation is above the Fed’s 2% target, the Fed will raise rates, which helps the USD value. When inflation falls below 2% or the Unemployment Rate is too high, the Fed may lower interest rates, which weighs on the Greenback.
In extreme situations, the Federal Reserve can also print more Dollars and enact quantitative easing (QE). QE is the process by which the Fed substantially increases the flow of credit in a stuck financial system. It is a non-standard policy measure used when credit has dried up because banks will not lend to each other (out of the fear of counterparty default). It is a last resort when simply lowering interest rates is unlikely to achieve the necessary result. It was the Fed’s weapon of choice to combat the credit crunch that occurred during the Great Financial Crisis in 2008. It involves the Fed printing more Dollars and using them to buy US government bonds predominantly from financial institutions. QE usually leads to a weaker US Dollar.
Quantitative tightening (QT) is the reverse process whereby the Federal Reserve stops buying bonds from financial institutions and does not reinvest the principal from the bonds it holds maturing in new purchases. It is usually positive for the US Dollar.
Information on these pages contains forward-looking statements that involve risks and uncertainties. Markets and instruments profiled on this page are for informational purposes only and should not in any way come across as a recommendation to buy or sell in these assets. You should do your own thorough research before making any investment decisions. FXStreet does not in any way guarantee that this information is free from mistakes, errors, or material misstatements. It also does not guarantee that this information is of a timely nature. Investing in Open Markets involves a great deal of risk, including the loss of all or a portion of your investment, as well as emotional distress. All risks, losses and costs associated with investing, including total loss of principal, are your responsibility. The views and opinions expressed in this article are those of the authors and do not necessarily reflect the official policy or position of FXStreet nor its advertisers. The author will not be held responsible for information that is found at the end of links posted on this page.
If not otherwise explicitly mentioned in the body of the article, at the time of writing, the author has no position in any stock mentioned in this article and no business relationship with any company mentioned. The author has not received compensation for writing this article, other than from FXStreet.
FXStreet and the author do not provide personalized recommendations. The author makes no representations as to the accuracy, completeness, or suitability of this information. FXStreet and the author will not be liable for any errors, omissions or any losses, injuries or damages arising from this information and its display or use. Errors and omissions excepted.
The author and FXStreet are not registered investment advisors and nothing in this article is intended to be investment advice.
Recommended content
Editors’ Picks

EUR/USD looks weak in the low-1.1300s
Following the release of the headline US PCE in April, which came in below forecasts, EUR/USD continues to be on the defensive and navigates the low-1.1300s on the back of a decent rebound in the US Dollar. Spot, in the meantime, is expected to enter a cautious mode pre-ECB meeting in the next week.

GBP/USD comes under pressure, back near 1.3470
The selling momentum now gathers pace around the British Pound, sending GBP/USD to the area of 1.3480-1.3470 at the end of the week. This occurs in the midst of an acceptable bounce in the Greenback, as investors continue to evaluate the lower-than-expected US PCE readings.

Gold keeps its offerd bias unchanged around $3,300
Gold remains on the defensive around the $3,300 mark per troy ounce in the wake of weaker-than-estimated US inflation data for April. In the meantime, trade uncertainty and lower US yields seem to limit the metal’s downside.

Dogecoin risks extended fall as Elon Musk exits DOGE
Musk will meet President Trump on his last working day as a Special Government Employee on Friday. Dogecoin has fallen significantly this week, putting the early May gains at risk.

US inflation stays stable, but tariff risks remain elevated as US/China talks break down
US equity market futures are pointing to a lower open for the US on Friday, as the market digests a social media post from the White House said that China had violated its agreement with the US. Trump blames himself for this, saying that he was too nice to China two weeks ago when they agreed new terms of trade and lowered tariffs.

The Best brokers to trade EUR/USD
SPONSORED Discover the top brokers for trading EUR/USD in 2025. Our list features brokers with competitive spreads, fast execution, and powerful platforms. Whether you're a beginner or an expert, find the right partner to navigate the dynamic Forex market.