- NZD/USD could target the initial barrier at upper boundary of the rectangle around 0.6000.
- The 14-day Relative Strength Index remains above the 50 mark, continuing to attract buyers.
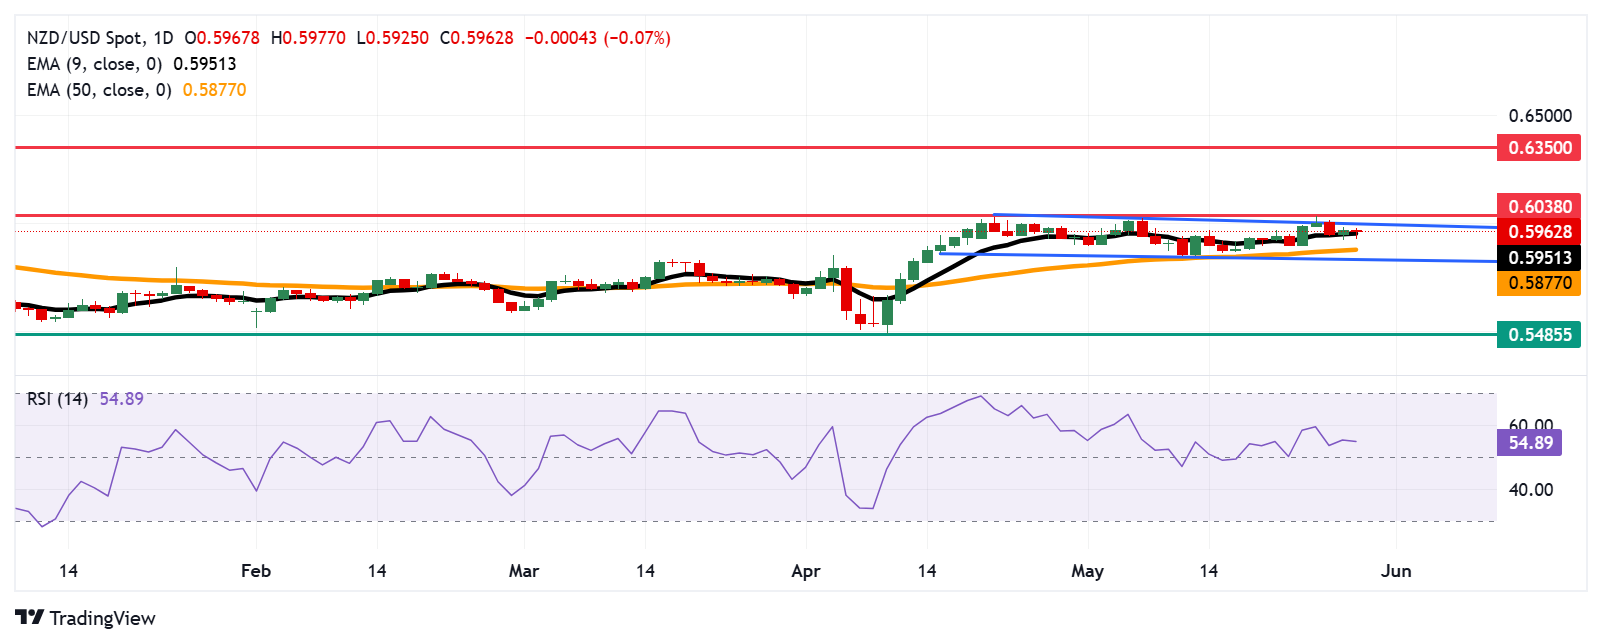
- The primary support appears at the nine-day EMA of 0.5951.
NZD/USD is trading around 0.5960 during the European hours on Thursday. The pair has trimmed its daily losses as a market bias remains neutral. As indicating by the technical analysis of the daily chart, the pair is consolidating within a rectangular pattern and hovering around a nine-day Exponential Moving Average (EMA).
However, the bullish bias is likely to emerge as the 14-day Relative Strength Index (RSI) is maintaining its position slightly above the 50 mark. This suggests that NZD/USD pair continues to attract buying interest.
On the upside, the NZD/USD pair may target the upper boundary of the consolidation range near 0.6000, followed by the next target at the six-month high of 0.6038, last reached in November 2024. A successful breach above this key resistance zone could support the bullish bias to develop and open the doors for the pair to explore the region around the seven-month high of 0.6350, marked in October 2024.
The NZD/USD pair could find the initial support at the nine-day EMA of 0.5951, followed by the 50-day EMA at 0.5877. A break below these levels could weaken the short- and medium-term price momentum and prompt the pair to break below the rectangle’s lower boundary around 0.5830. Further decline beneath this crucial support zone could cause the emergence of the bearish bias and pave the way for a deeper decline toward 0.5485, a level not seen since March 2020.
NZD/USD: Daily Chart
New Zealand Dollar PRICE Today
The table below shows the percentage change of New Zealand Dollar (NZD) against listed major currencies today. New Zealand Dollar was the weakest against the Australian Dollar.
| USD | EUR | GBP | JPY | CAD | AUD | NZD | CHF | |
|---|---|---|---|---|---|---|---|---|
| USD | 0.15% | 0.03% | 0.25% | -0.04% | -0.18% | 0.09% | 0.31% | |
| EUR | -0.15% | -0.12% | 0.10% | -0.19% | -0.27% | -0.07% | 0.15% | |
| GBP | -0.03% | 0.12% | 0.23% | -0.06% | -0.14% | 0.03% | 0.19% | |
| JPY | -0.25% | -0.10% | -0.23% | -0.28% | -0.45% | -0.21% | -0.04% | |
| CAD | 0.04% | 0.19% | 0.06% | 0.28% | -0.19% | 0.13% | 0.24% | |
| AUD | 0.18% | 0.27% | 0.14% | 0.45% | 0.19% | 0.20% | 0.32% | |
| NZD | -0.09% | 0.07% | -0.03% | 0.21% | -0.13% | -0.20% | 0.12% | |
| CHF | -0.31% | -0.15% | -0.19% | 0.04% | -0.24% | -0.32% | -0.12% |
The heat map shows percentage changes of major currencies against each other. The base currency is picked from the left column, while the quote currency is picked from the top row. For example, if you pick the New Zealand Dollar from the left column and move along the horizontal line to the US Dollar, the percentage change displayed in the box will represent NZD (base)/USD (quote).
Information on these pages contains forward-looking statements that involve risks and uncertainties. Markets and instruments profiled on this page are for informational purposes only and should not in any way come across as a recommendation to buy or sell in these assets. You should do your own thorough research before making any investment decisions. FXStreet does not in any way guarantee that this information is free from mistakes, errors, or material misstatements. It also does not guarantee that this information is of a timely nature. Investing in Open Markets involves a great deal of risk, including the loss of all or a portion of your investment, as well as emotional distress. All risks, losses and costs associated with investing, including total loss of principal, are your responsibility. The views and opinions expressed in this article are those of the authors and do not necessarily reflect the official policy or position of FXStreet nor its advertisers. The author will not be held responsible for information that is found at the end of links posted on this page.
If not otherwise explicitly mentioned in the body of the article, at the time of writing, the author has no position in any stock mentioned in this article and no business relationship with any company mentioned. The author has not received compensation for writing this article, other than from FXStreet.
FXStreet and the author do not provide personalized recommendations. The author makes no representations as to the accuracy, completeness, or suitability of this information. FXStreet and the author will not be liable for any errors, omissions or any losses, injuries or damages arising from this information and its display or use. Errors and omissions excepted.
The author and FXStreet are not registered investment advisors and nothing in this article is intended to be investment advice.
Recommended content
Editors’ Picks

EUR/USD struggles to retain 1.1500 as USD gains traction
EUR/USD hovers around the 1.1500 level in the American session on Friday. The US Dollar surges despite dovish comments from Fed Governor Waller, supporting a rate cut as soon as July. The mood sours as investors weigh Middle East developments.

GBP/USD dives below 1.3500 after weak UK data, resurgent USD
GBP/USD turned red for the day and approaches the 1.3450 area as the week comes to an end. Earlier in the day, the UK reported weak Retail Sales figures, although the ongoing slump seems related to renewed risk aversion fueling safe-haven US Dollar demand.

Gold surges above $3,3360 as fears kick in
Gold gathers near-term momentum and trades near $3,370 ahead of the weekly close, as risk sentiment took a turn to the south. Following a positive start, Wall Street turned south. Middle East tensions and massive back-and-forth missile exchanges between Iran and Israel seem to be behind the ongoing run to safety.

Ripple Price Prediction: How tokenized treasuries could accelerate XRP to $10 by end-2025
Ondo Finance launched tokenized treasuries on the XRP Ledger in June, paving the way for seamless institutional adoption. The market capitalization of tokenized treasuries has grown to $5.9 billion despite market uncertainty over US tariffs.

Weekly focus: War and risk of escalation weigh on market sentiment
The war between Israel and Iran and the risk of further escalation weighed on markets this week. Equity markets largely traded in red and US treasury yields slid lower. That said, markets were by no means in full risk-off sentiment.

The Best brokers to trade EUR/USD
SPONSORED Discover the top brokers for trading EUR/USD in 2025. Our list features brokers with competitive spreads, fast execution, and powerful platforms. Whether you're a beginner or an expert, find the right partner to navigate the dynamic Forex market.